Introduction
In ClickUp, Structure is a way to organize your work into a hierarchy of Spaces, Folders, Lists, and Tasks. This hierarchy provides a visual and organized way to manage complex projects by breaking them down into manageable components, facilitating better task tracking and management.
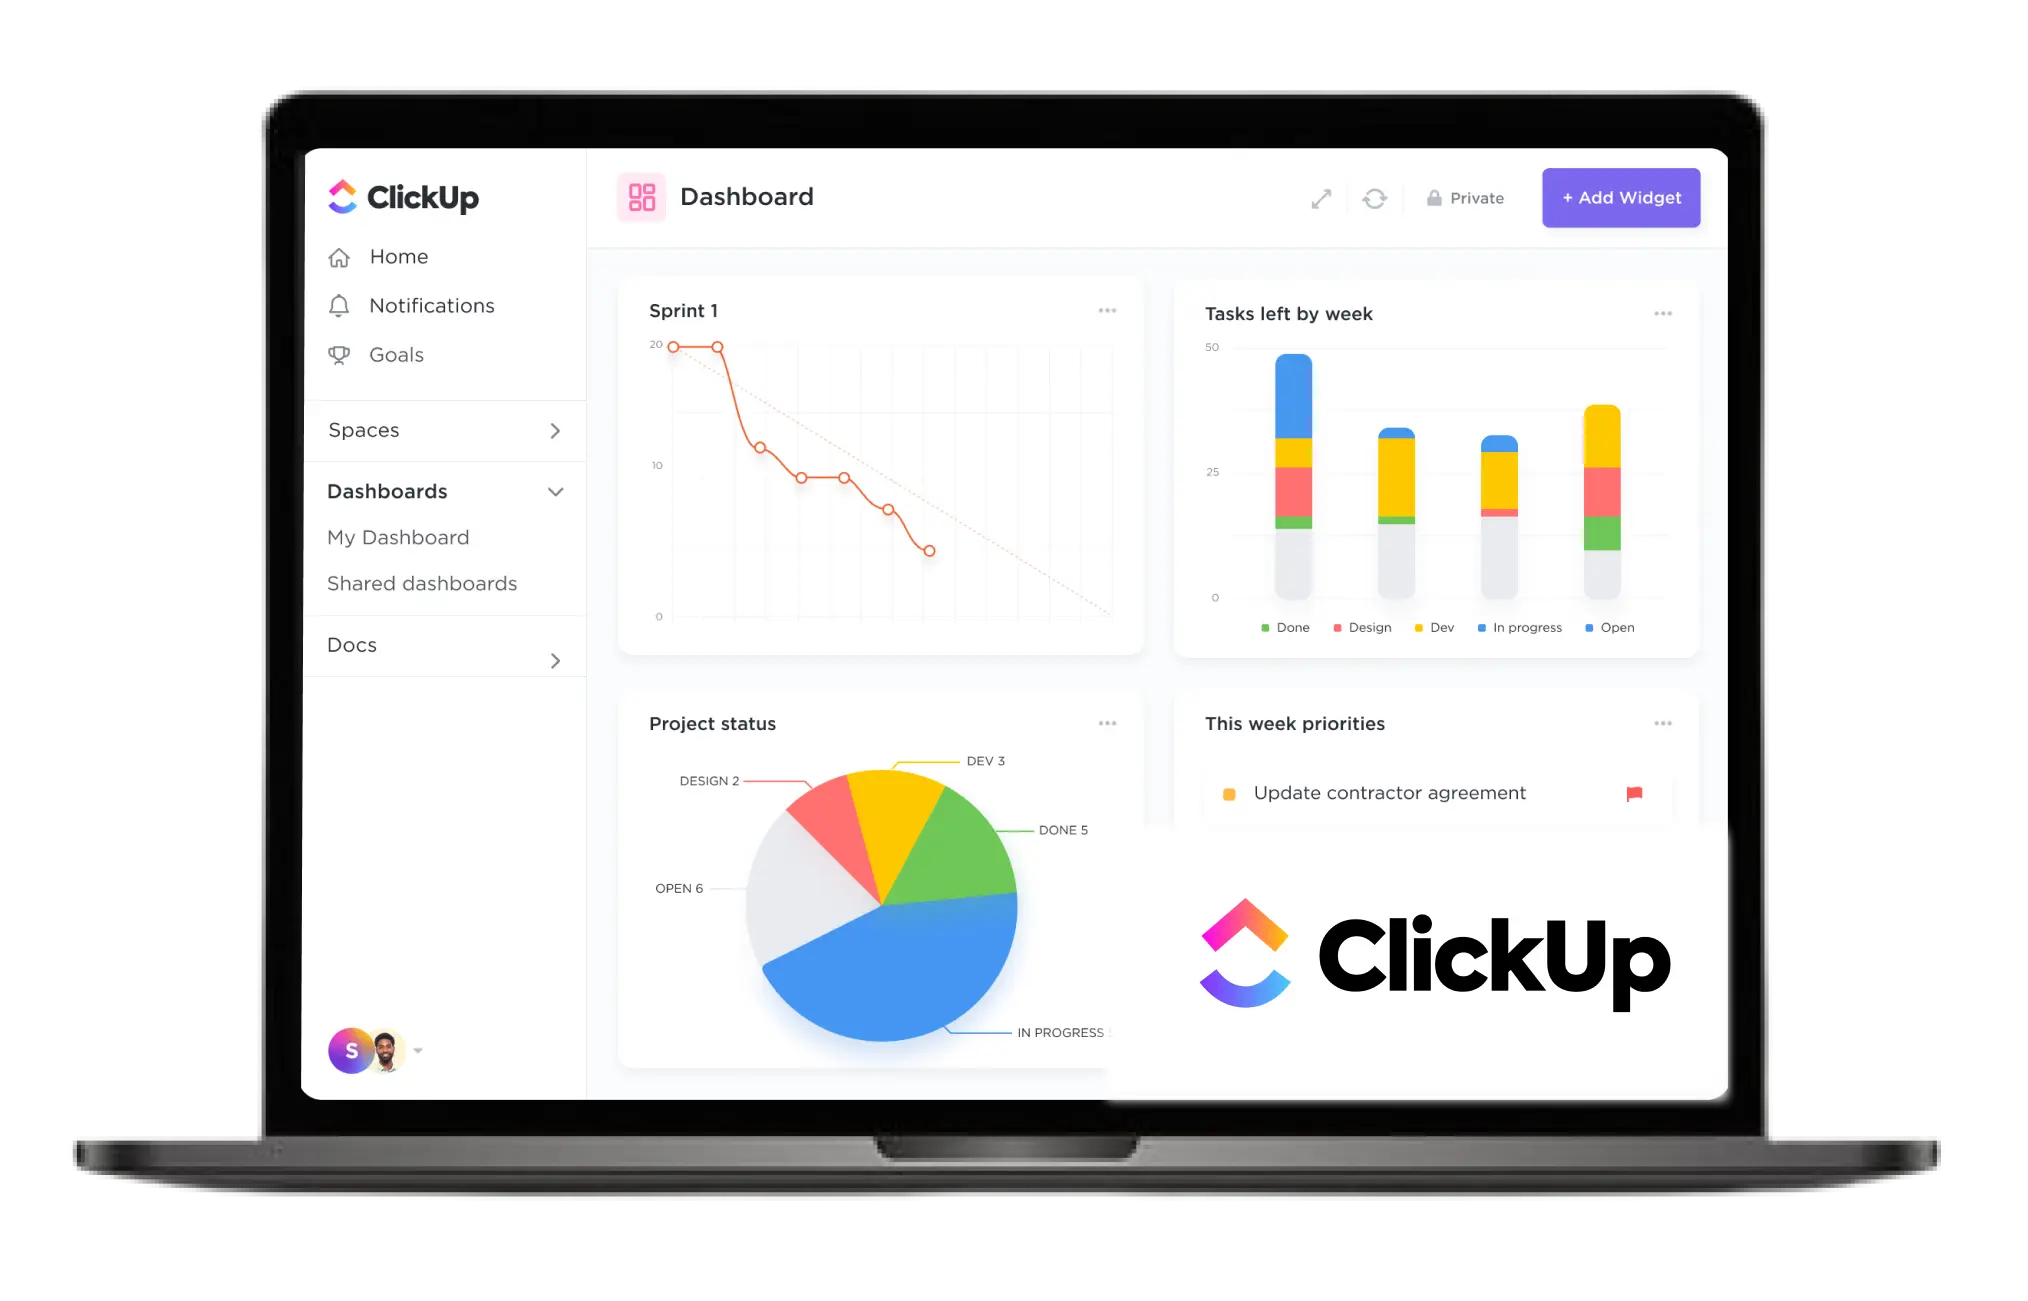
Dashboards
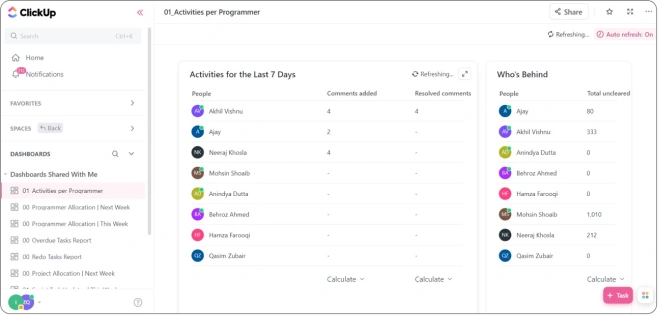
Activities Per Programer
It is a focused view that provides an insightful breakdown of tasks and projects assigned to individual programmers or developers. This dashboard enables teams to track the workload, progress, and efficiency of each programmer, facilitating better resource allocation and project management.
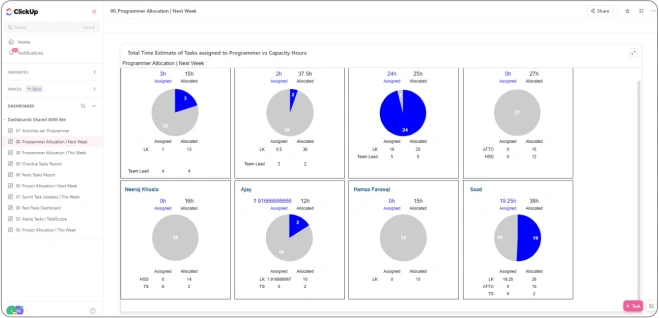
Programmer Allocation
It is a powerful tool that provides a clear and concise overview of your team's resource allocation within your programming or development projects. It offers real-time insights into who is working on what, project progress, and resource availability. With this dashboard, you can optimize work distribution, avoid bottlenecks, and ensure efficient utilization of your programming talent.
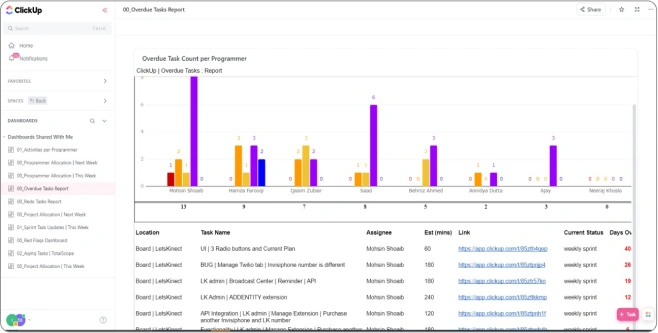
Task Report
It is your go-to command center for tracking and analyzing task-related data. It provides a comprehensive visual summary of your team's progress, task statuses, deadlines, and more. With intuitive charts and graphs, this dashboard transforms complex task data into actionable insights, helping you make informed decisions, allocate resources effectively, and ensure project success.
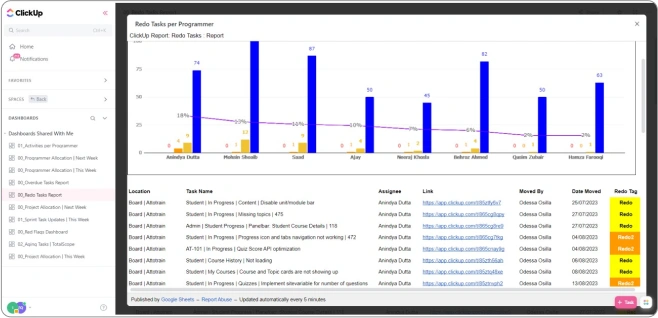
Redo Task Per Programmer
It is your go-to command center for tracking and analyzing task-related data. It provides a comprehensive visual summary of your team's progress, task statuses, deadlines, and more. With intuitive charts and graphs, this dashboard transforms complex task data into actionable insights, helping you make informed decisions, allocate resources effectively, and ensure project success.
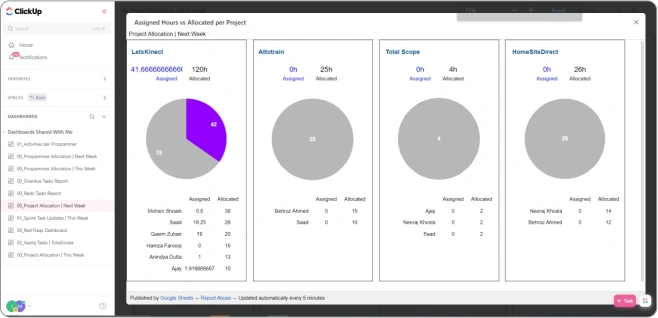
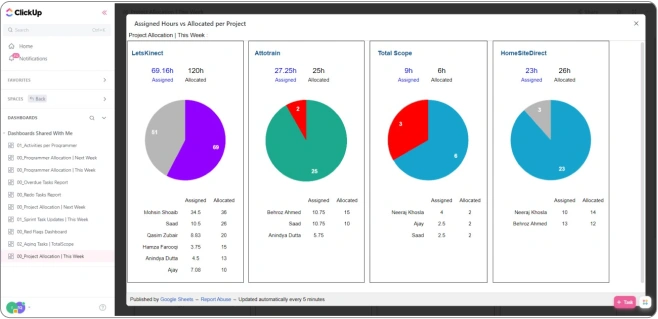
Assigned Hour vs Allocated Per Project
It provides a concise overview of task allocation efficiency. It helps teams assess how many hours are assigned to a project versus the actual hours allocated, ensuring resources are optimally utilized for successful project management.
QA Per Programmer
It provides a snapshot of quality assurance efforts within a software development team. It tracks the number of QA tests conducted by each programmer, ensuring accountability and efficient bug resolution. This tool aids in maintaining high software quality and streamlining the development process.
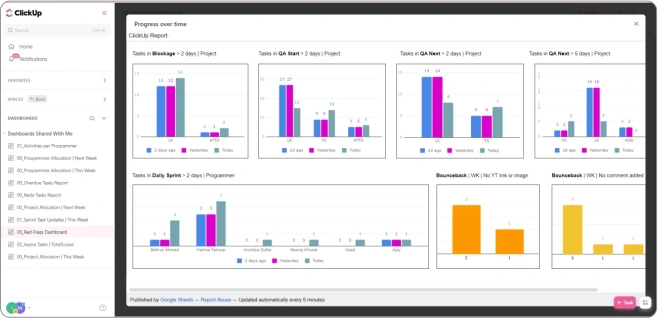
Progress Over Time
This dashboard provides a visual timeline of how your work has evolved, helping you track milestones, identify trends, and measure performance. With this dashboard, you can make data-driven decisions, stay on top of deadlines, and celebrate your team's achievements as you navigate the ever-changing landscape of your projects.
Assigned Task
It provides a real-time overview of all tasks assigned to each team member, making it easy to manage and track their work. With a quick glance, you can see priorities, due dates, and progress, allowing you to manage tasks efficiently and meet deadlines with ease.
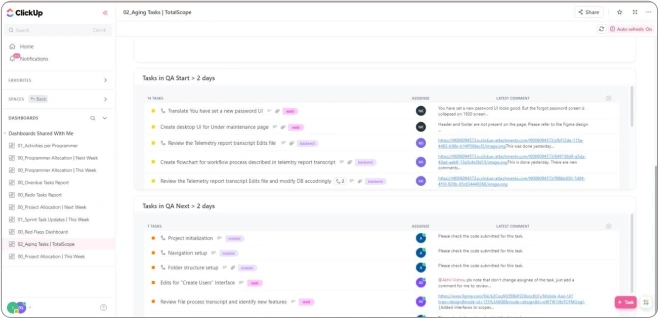
Project Allocation
It provides a clear and concise overview of how your team's time and skills are distributed across various projects. With intuitive visualizations and real-time data, this dashboard enables you to optimize workloads, allocate resources efficiently, and ensure projects stay on schedule.