In the era of information overload, data is at the forefront of almost everything we do. Whether for getting new insights, making decisions, or predicting business trends, the quality and management of data are crucial.
If you’re a company or a professional looking to master data analysis, this blog will guide you through detailed steps, tools, technologies, and best practices for effective data analysis. Keep reading as we talk about transforming raw data into powerful insights.
What is Data Analysis?
Data analysis is a process of inspecting, cleaning, transforming, and interpreting data to find meaningful patterns and insights. It’s like having a lot of puzzle pieces (data), and data analysis helps you put those pieces together to see the bigger picture.
Data analysis bridges the gap between raw data and informed-decision making, enabling businesses and individuals to act strategically. In business, several types of data analysis include:
- Descriptive analysis: Summarizing past data to analyze what happened.
- Diagnostic analysis: Identifying the reasons behind present outcomes.
- Predictive analysis: Using data to predict future trends.
- Prescriptive analysis: Recommending actions by combining insights from all previous analyses.
What is the Data Analysis Process?
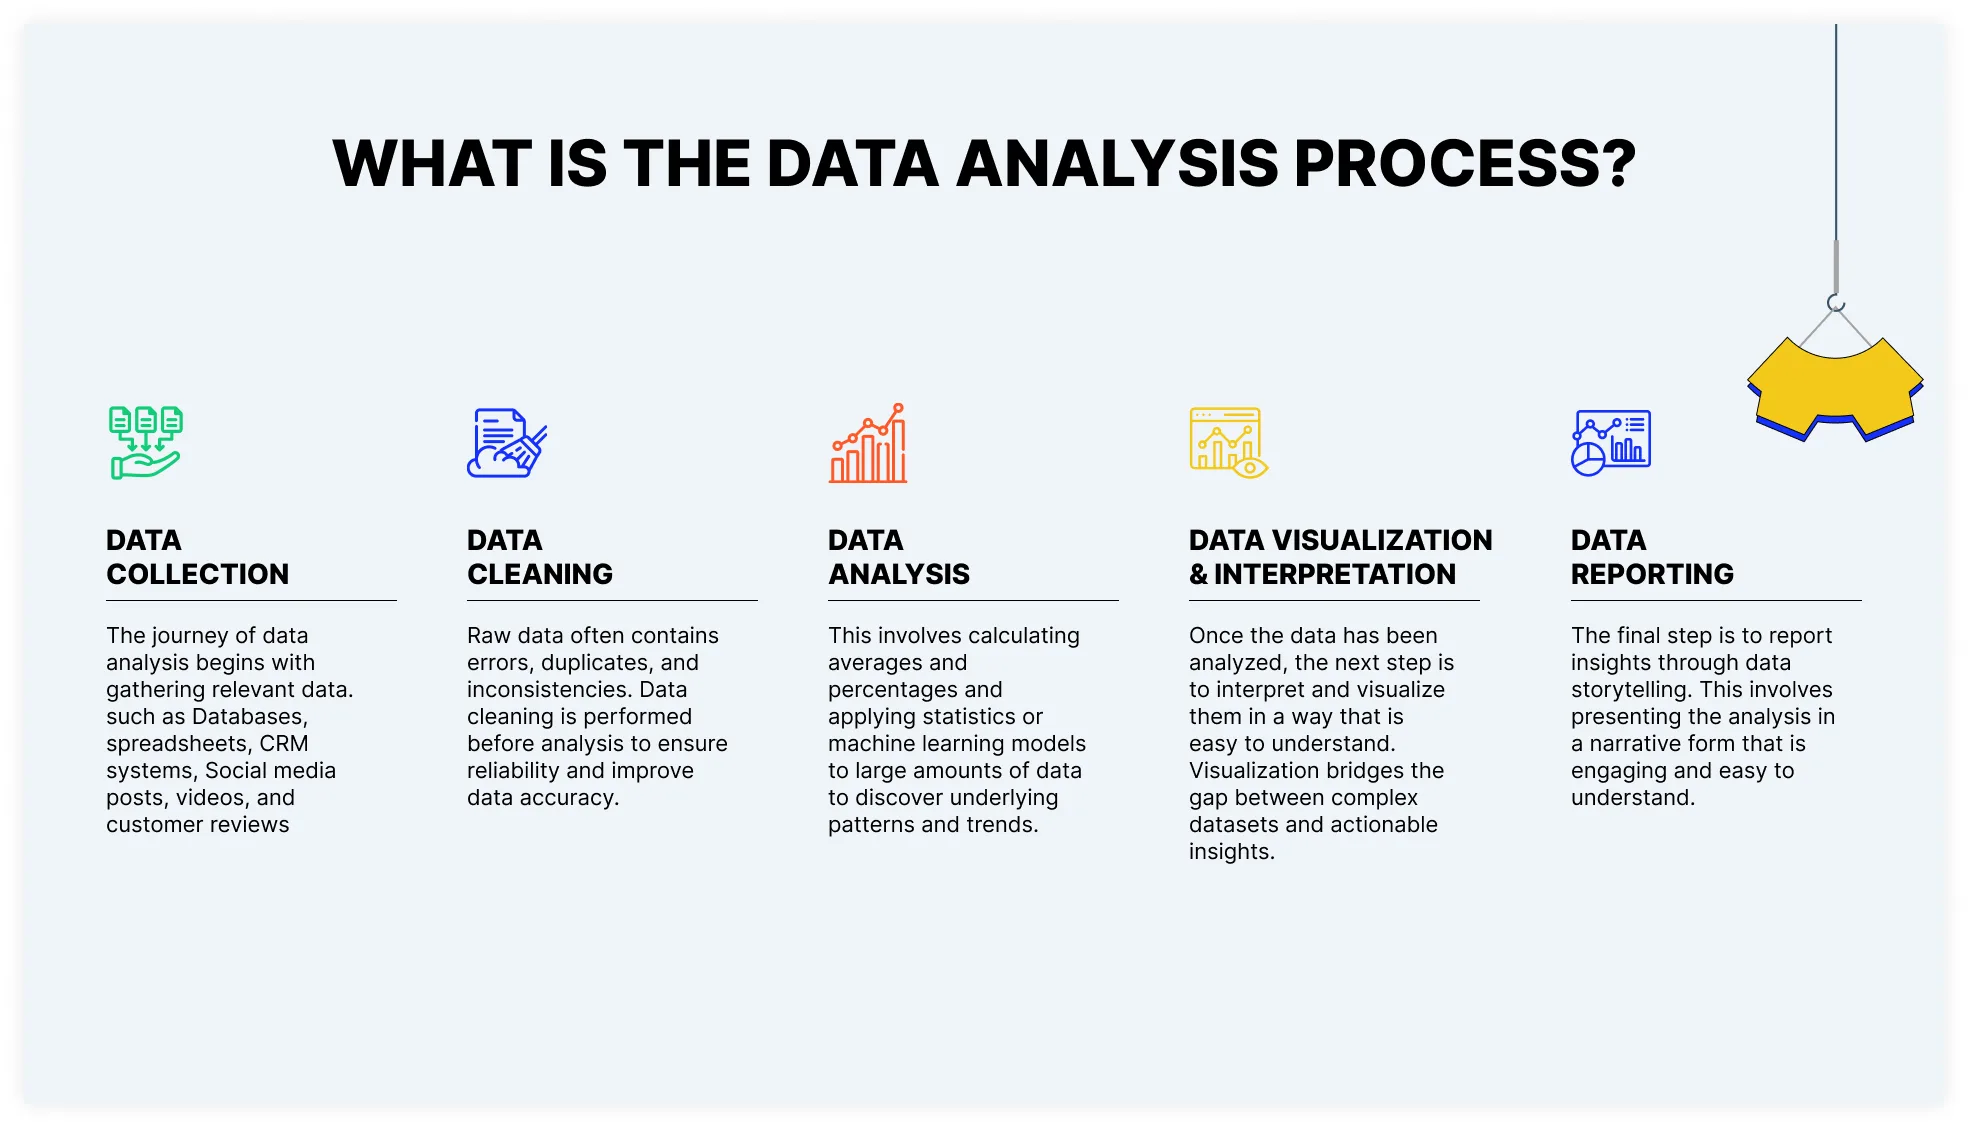
Within the landscape of business analysis, the journey from data collection to insight generation is a critical process. The five simple steps of the data analysis process are:
- Data collection
- Data cleaning
- Data analysis
- Data visualization and interpretation
- Data reporting
Step 1: Data Collection
The journey of data analysis begins with gathering relevant data. Data collection can be done from various sources:
- Structured Data: Databases, spreadsheets, and CRM systems.
- Unstructured Data: Social media posts, videos, and customer reviews.
Step 2: Data Cleaning and Transformation
Raw data often contains errors, duplicates, and inconsistencies. Data cleaning is performed before analysis to ensure reliability and improve data accuracy. It involves:
- Removing duplicates and outliers
- Handling missing values through data imputation or elimination
- Standardizing formats for consistency (data transformation)
Step 3: Data Analysis
Once the data is cleaned, it’s time for the actual data analysis. This involves calculating averages and percentages and applying statistics or machine learning models to large amounts of data to discover underlying patterns and trends.
Step 4: Data Visualization and Interpretation
Once the data has been analyzed, the next step is to interpret and visualize them in a way that is easy to understand. Visualization bridges the gap between complex datasets and actionable insights. Tools like Tableau, Power BI, and Python libraries help create:
- Charts and graphs to identify trends
- Dashboards for interactive exploration
Step 5: Reporting Insights
The final step is to report insights through data storytelling. This involves presenting the analysis in a narrative form that is engaging and easy to understand. A written report or a presentation with charts and graphs is the best way to communicate your findings to non-technical audiences.
Which Tool is Used For Data Analysis?
Data analysis is a complex yet necessary process for businesses and organizations. Various tools and technologies are available to help data analysts make competitive decisions, lead projects, and engage effectively with target audiences. These tools include programming languages and visualization tools. Below are some of the most popular tools for data analysis:
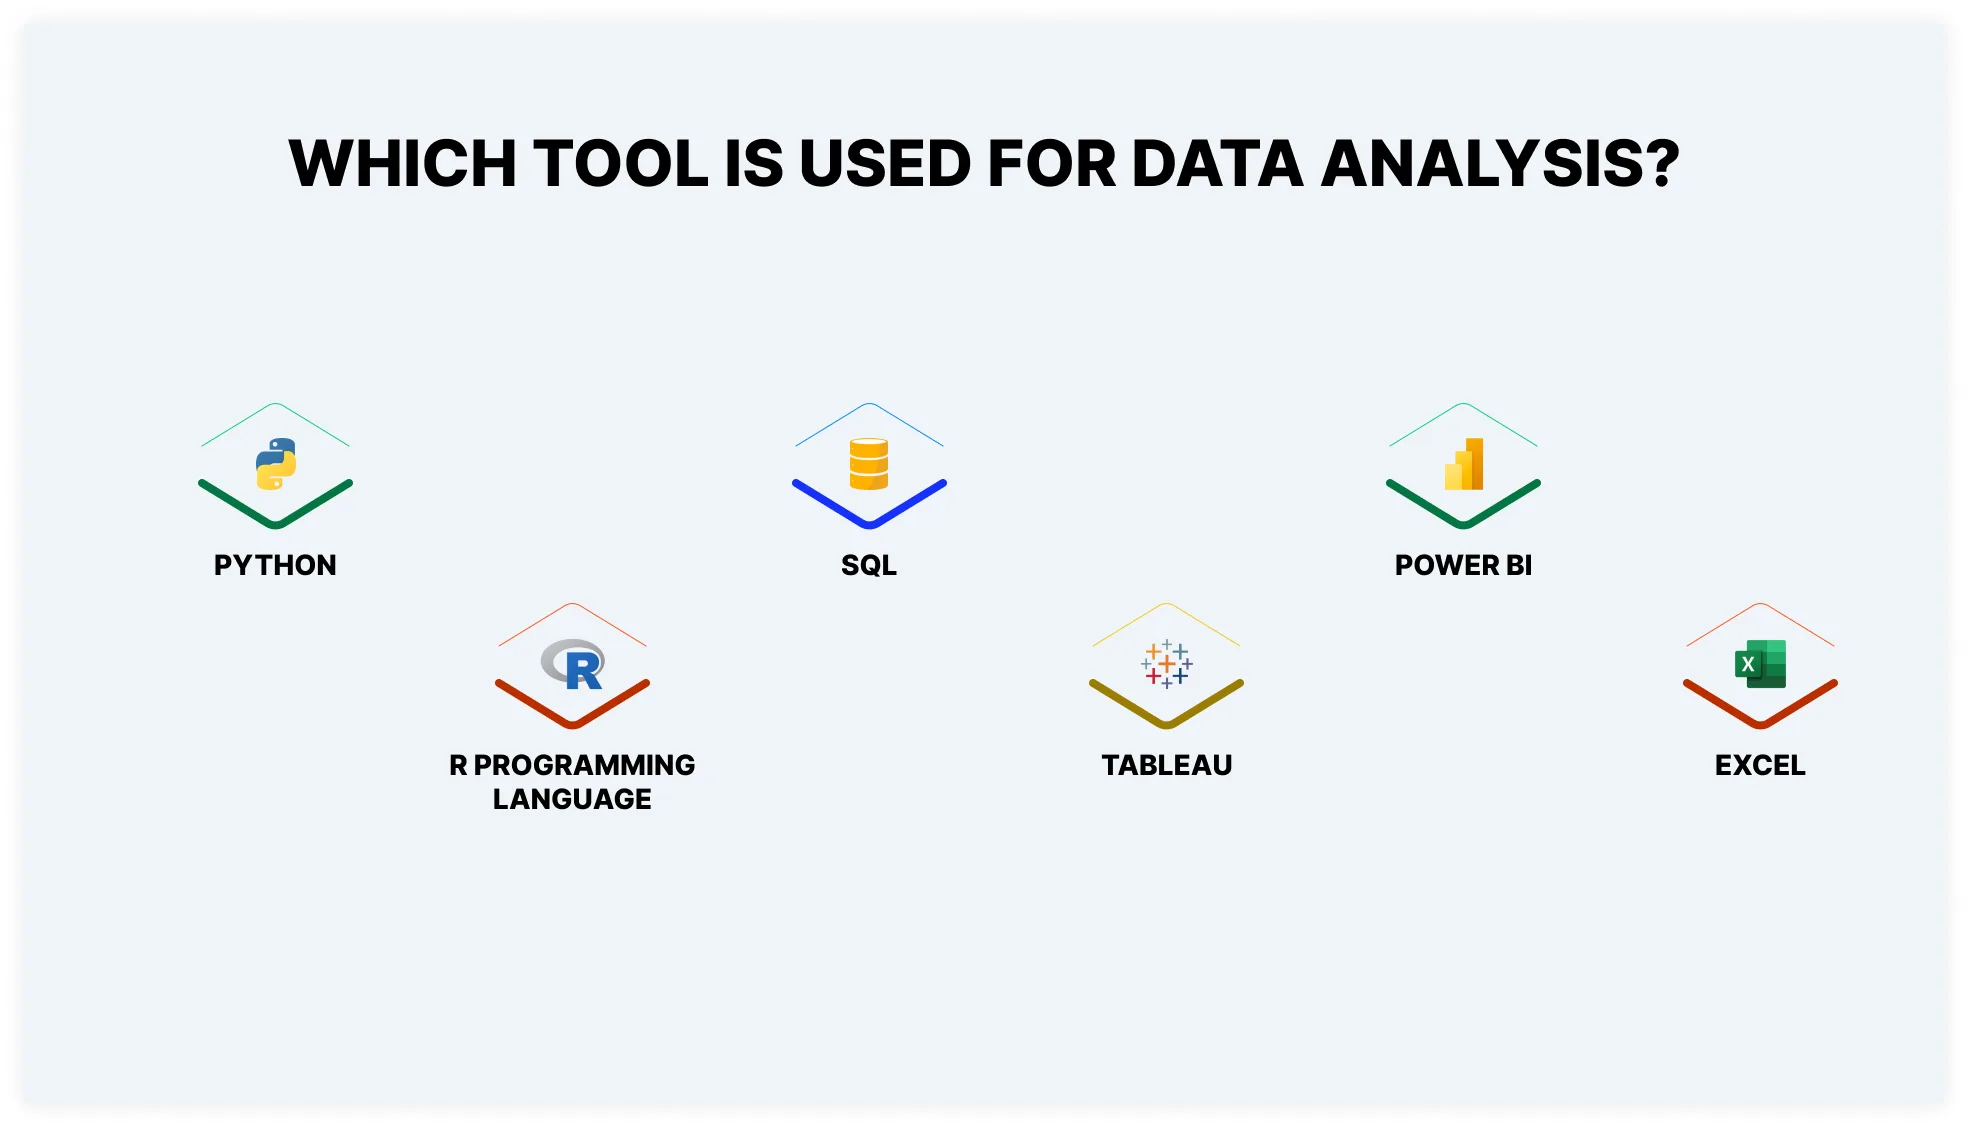
Python
Python is a powerful programming language that’s used for all kinds of data analysis. It can handle larger datasets and more complex tasks like machine learning and automation. With libraries like Pandas and Matplotlib, Python helps you clean, analyze, and visualize data quickly.
R Programming Language
R is another programming language widely used for statistics and data analysis. Like Python, R has many libraries that help you clean, analyze, and visualize data but mainly focus on data science and statistics.
SQL
SQL (Structured Query Language) is a unique language used to interact with databases. SQL helps you retrieve specific data from a database by querying it in a structured and precise manner. It’s a must-know tool for dealing with large amounts of data stored in relational databases.
Tableau
Tableau is a user-friendly tool that helps you turn your data into beautiful, interactive charts and dashboards. Using this tool doesn’t require coding. It’s all about dragging and dropping data to create visuals that make your insights easy to understand.
Power BI
Power BI is a Microsoft tool similar to Tableau. It helps you create interactive reports and dashboards that can be shared easily with others.
Excel
Most people are familiar with Excel, and it’s one of the most basic tools for data analysis. Data analysts can use Excel to organize data, create charts, and even do simple calculations.
What are Emerging Technologies and Future Trends in Data Analysis?
Recently, there has been a significant shift in how data scientists and analysts perform data analysis. In the coming years, emerging technologies are going to completely transform the data that is processed and utilized. Here is a list of some popular emerging technologies and future trends in data analysis:
- Artificial Intelligence (AI) and Machine Learning (ML): Augmented analytics use AI and ML to automate data processing tasks such as preparing data and generating insights.
- Natural Language Processing (NLP): NLP is transforming data analysis by enabling data extraction from unstructured data and understanding human language more accurately.
- Quantum computing: It is a multidisciplinary field that can be used in data analysis to analyze large data sets, find patterns, and solve optimization problems.
- Edge Computing: Edge computing allows data to be processed and analyzed at the source, enabling organizations to make real-time decisions and improve operational efficiency.
- Cloud Computing: Cloud computing has revolutionized how data is stored and accessed by providing tools and resources to process large amounts of data.
What are the Applications of Data Analysis?
Organizations use data analysis to make better decisions, improve efficiency, and predict future consequences. It is widely utilized in different industries, including:
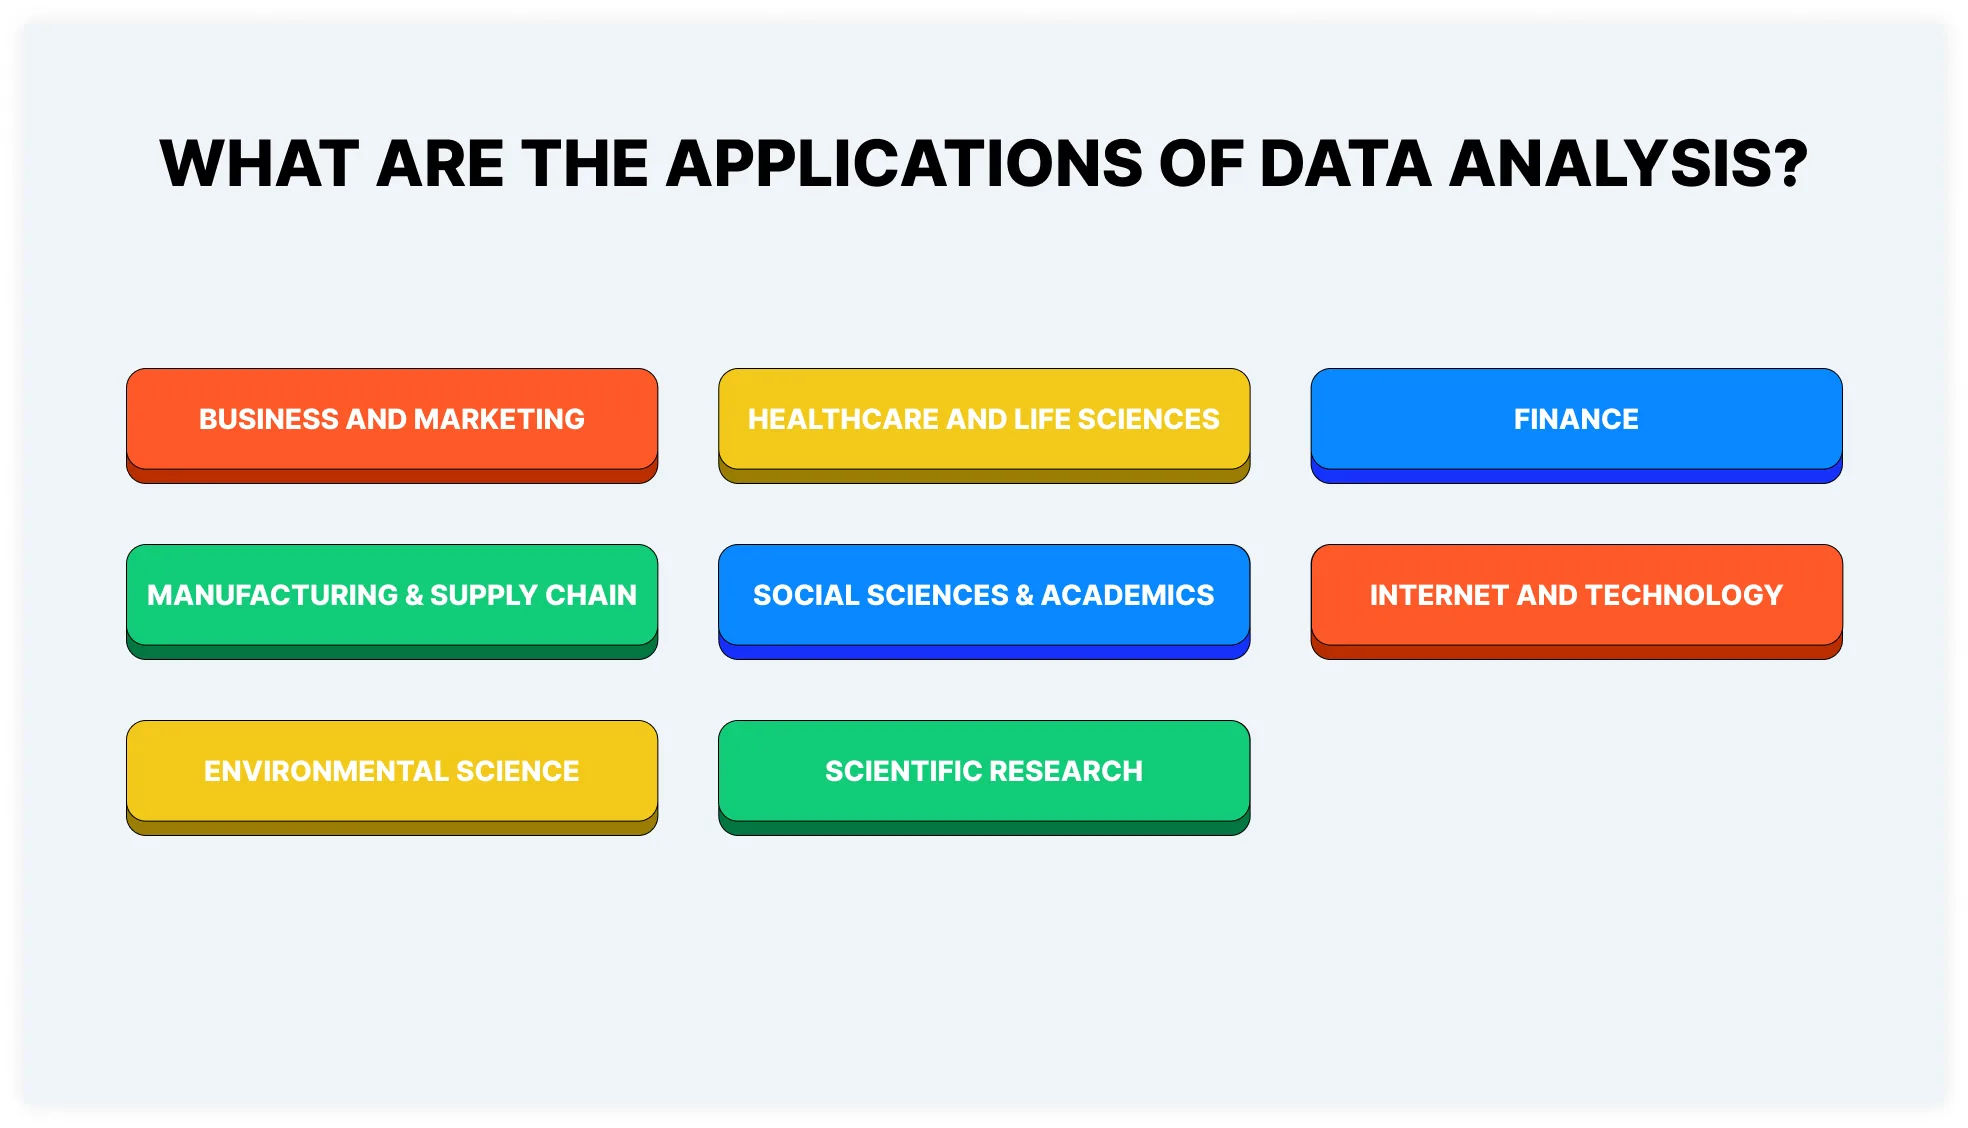
- Business and marketing
- Healthcare and life sciences
- Finance
- Manufacturing and supply chain
- Social sciences and academics
- Internet and technology
- Environmental science
- Scientific research
What are the Best Practices for Effective Data Analysis?
For mastering data analysis, it’s important to effectively and strategically plan every step of the data analysis process. Here are some of the best practices and strategies to enhance the quality of insights drawn from data and improve organizational performance:
- Establish clear objectives
- Ensure data quality and integrity
- Keep learning and updating skills
- Validate results through rigorous statistical testing
- Choose appropriate tools for advanced analytics and visualization
- Collaborate with cross-functional teams for maximum productivity
- Document data analysis process for reproducibility and transparency
- Communicate effectively with the target audience
What are some Challenges in Data Analysis?
Without a formal strategic plan and appropriate technology, organizations may miss out on their opportunity to improve business operations. Despite its potential, data analysis might come with challenges, such as:
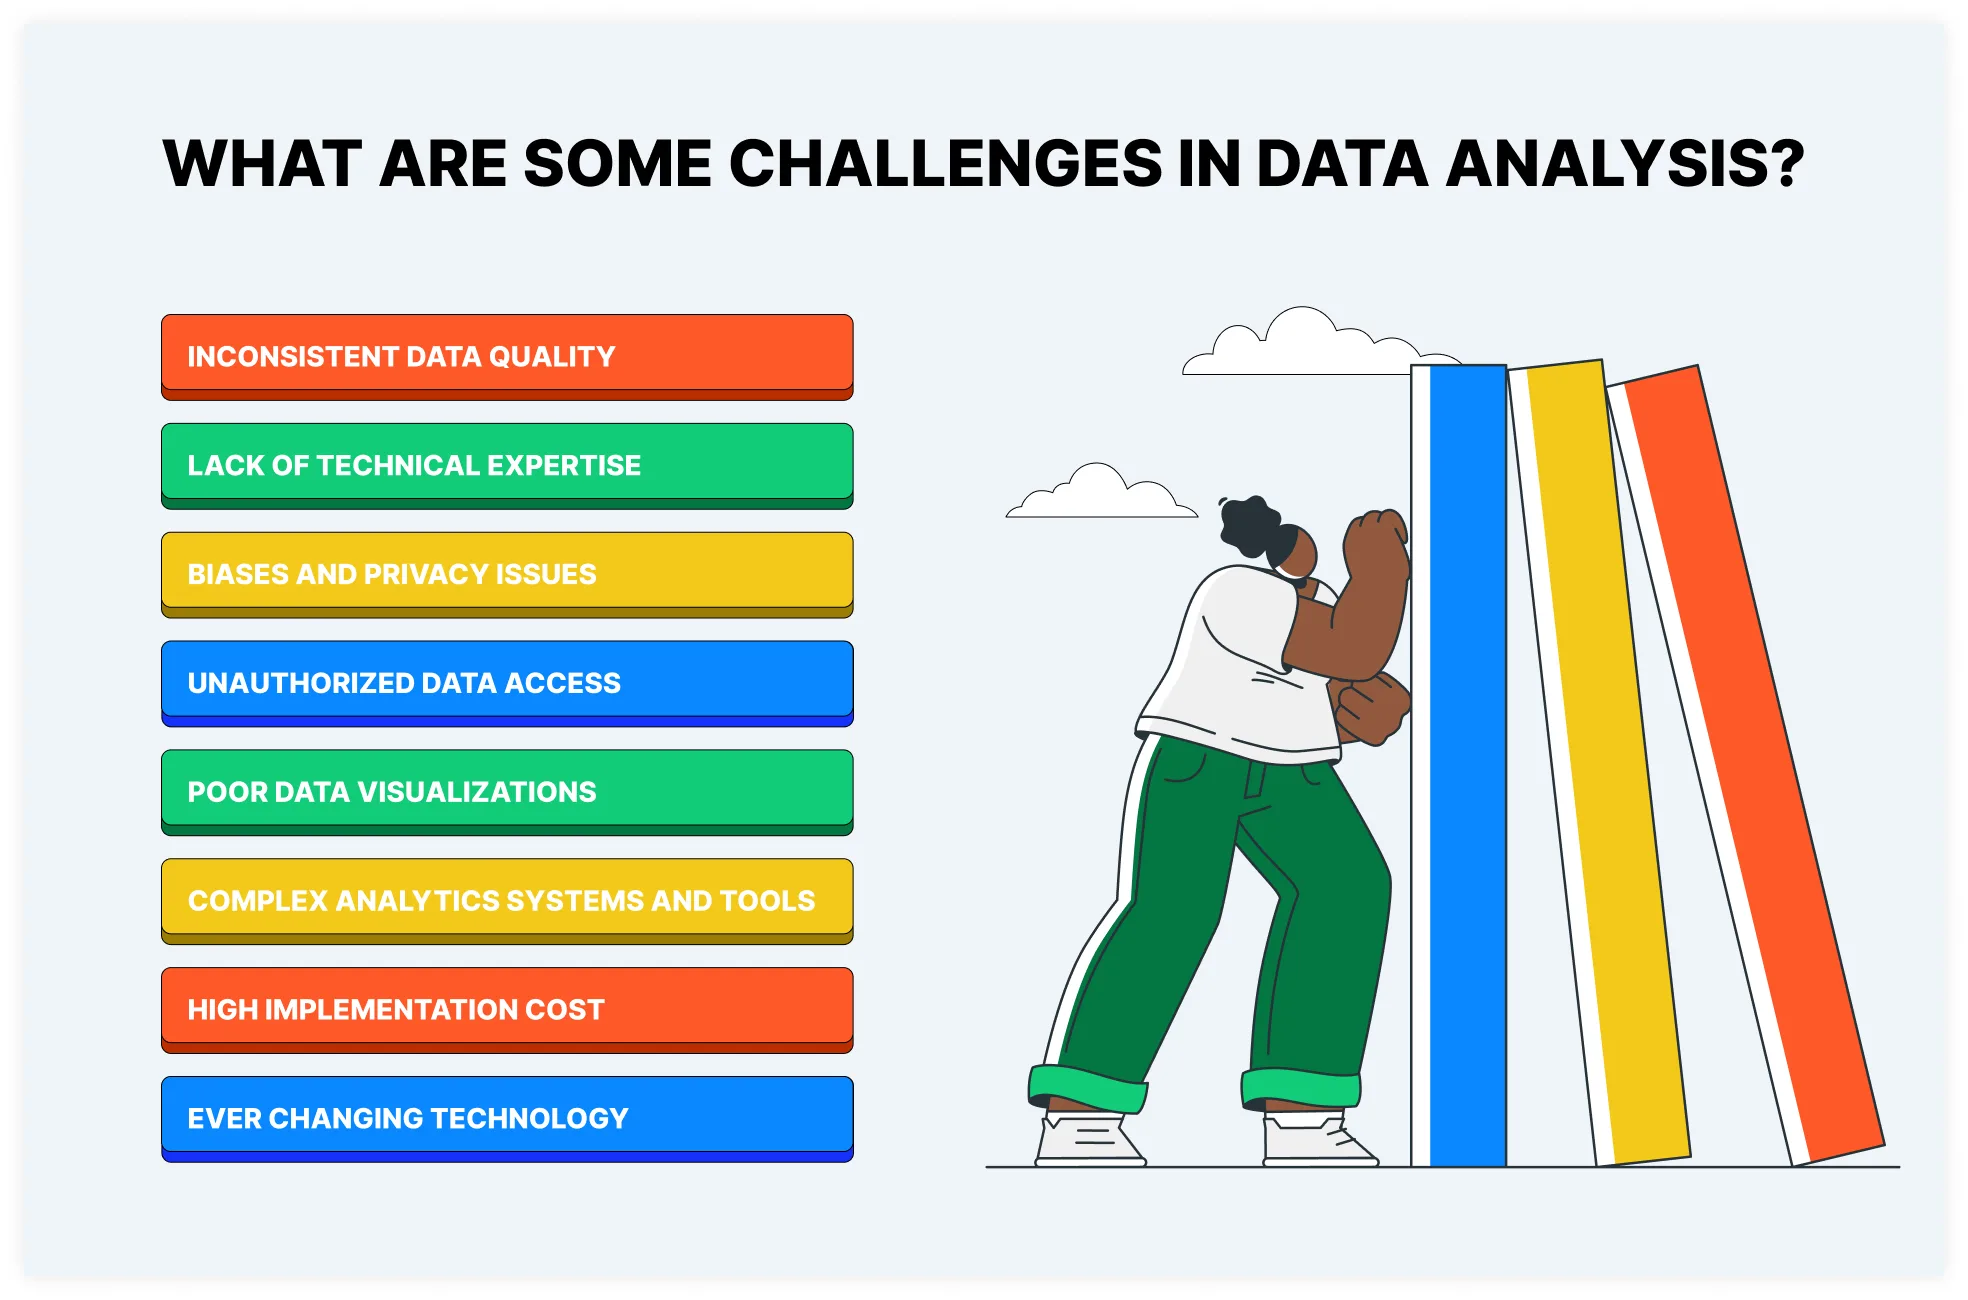
- Inconsistent data quality
- Lack of technical expertise
- Biases and privacy issues
- Unauthorized data access
- Poor data visualizations
- Complex analytics systems and tools
- High implementation cost
- Everchanging technology
Conclusion
Mastering data analysis allows organizations to transform raw data into powerful insights and innovations. By following the detailed steps of data analysis and utilizing appropriate tools and technologies, data analysts can make informed decisions based on facts, figures, and trends. Start your data analysis journey with Red Star Technologies and shape a better future for your business.


 October 10, 2025